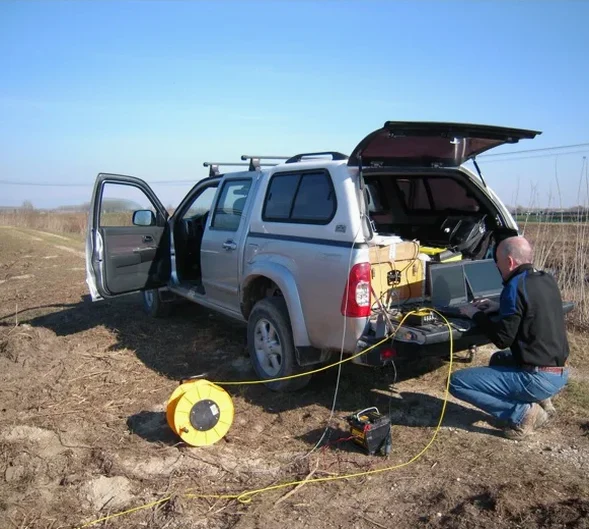
Many sites around Celbridge sit right on the edge of the Carboniferous limestone that defines the bedrock along the Liffey valley, and that boundary creates more variation in shallow rock quality than most people realise. A standard desk study won't tell you whether the limestone is pinnacled, karstified, or buried under a few metres of silty till. The seismic tomography survey maps those transitions directly, giving you a continuous velocity profile that exposes weak zones, fracture corridors, or solution features before they become a problem during excavation. We run both refraction and reflection arrays depending on what the site geometry allows, and when karst is suspected we combine the resistivity survey to cross-check low-velocity anomalies against electrical contrasts, which is a practical way to separate a water-filled cavity from a weathered clay seam without extra boreholes.
A seismic tomogram lets you trace the rockhead surface continuously across a site, rather than guessing between borehole points where it could dip or fault.